Overview
The essential real estate metrics every investor should know include:
- Net Operating Income (NOI)
- Capitalization Rate (Cap Rate)
- Internal Rate of Return (IRR)
- Cash Flow
- Cash on Cash Return
- Gross Rent Multiplier (GRM)
- Loan-to-Value Ratio (LTV)
- Debt Service Coverage Ratio (DSCR)
- Operating Expense Ratio (OER)
- Physical Vacancy Rate
Understanding and monitoring these metrics is crucial for making informed investment decisions. They provide critical insights into an asset's profitability, risk, and overall financial health. Investors who grasp these concepts position themselves to make strategic choices that can enhance their portfolio's performance.
Introduction
In the intricate world of real estate investment, understanding key financial metrics is essential for making informed decisions. Investors must navigate a complex landscape, where various indicators serve as guiding beacons. Metrics such as:
- Net Operating Income (NOI)
- Capitalization Rate (Cap Rate)
provide critical insights into income generation and investment viability. Meanwhile, Cash Flow and Internal Rate of Return (IRR) reveal the financial health of properties. As investors strive to optimize their portfolios, grasping these fundamental concepts not only enhances their strategies but also positions them for greater success in the competitive real estate market.
Net Operating Income (NOI)
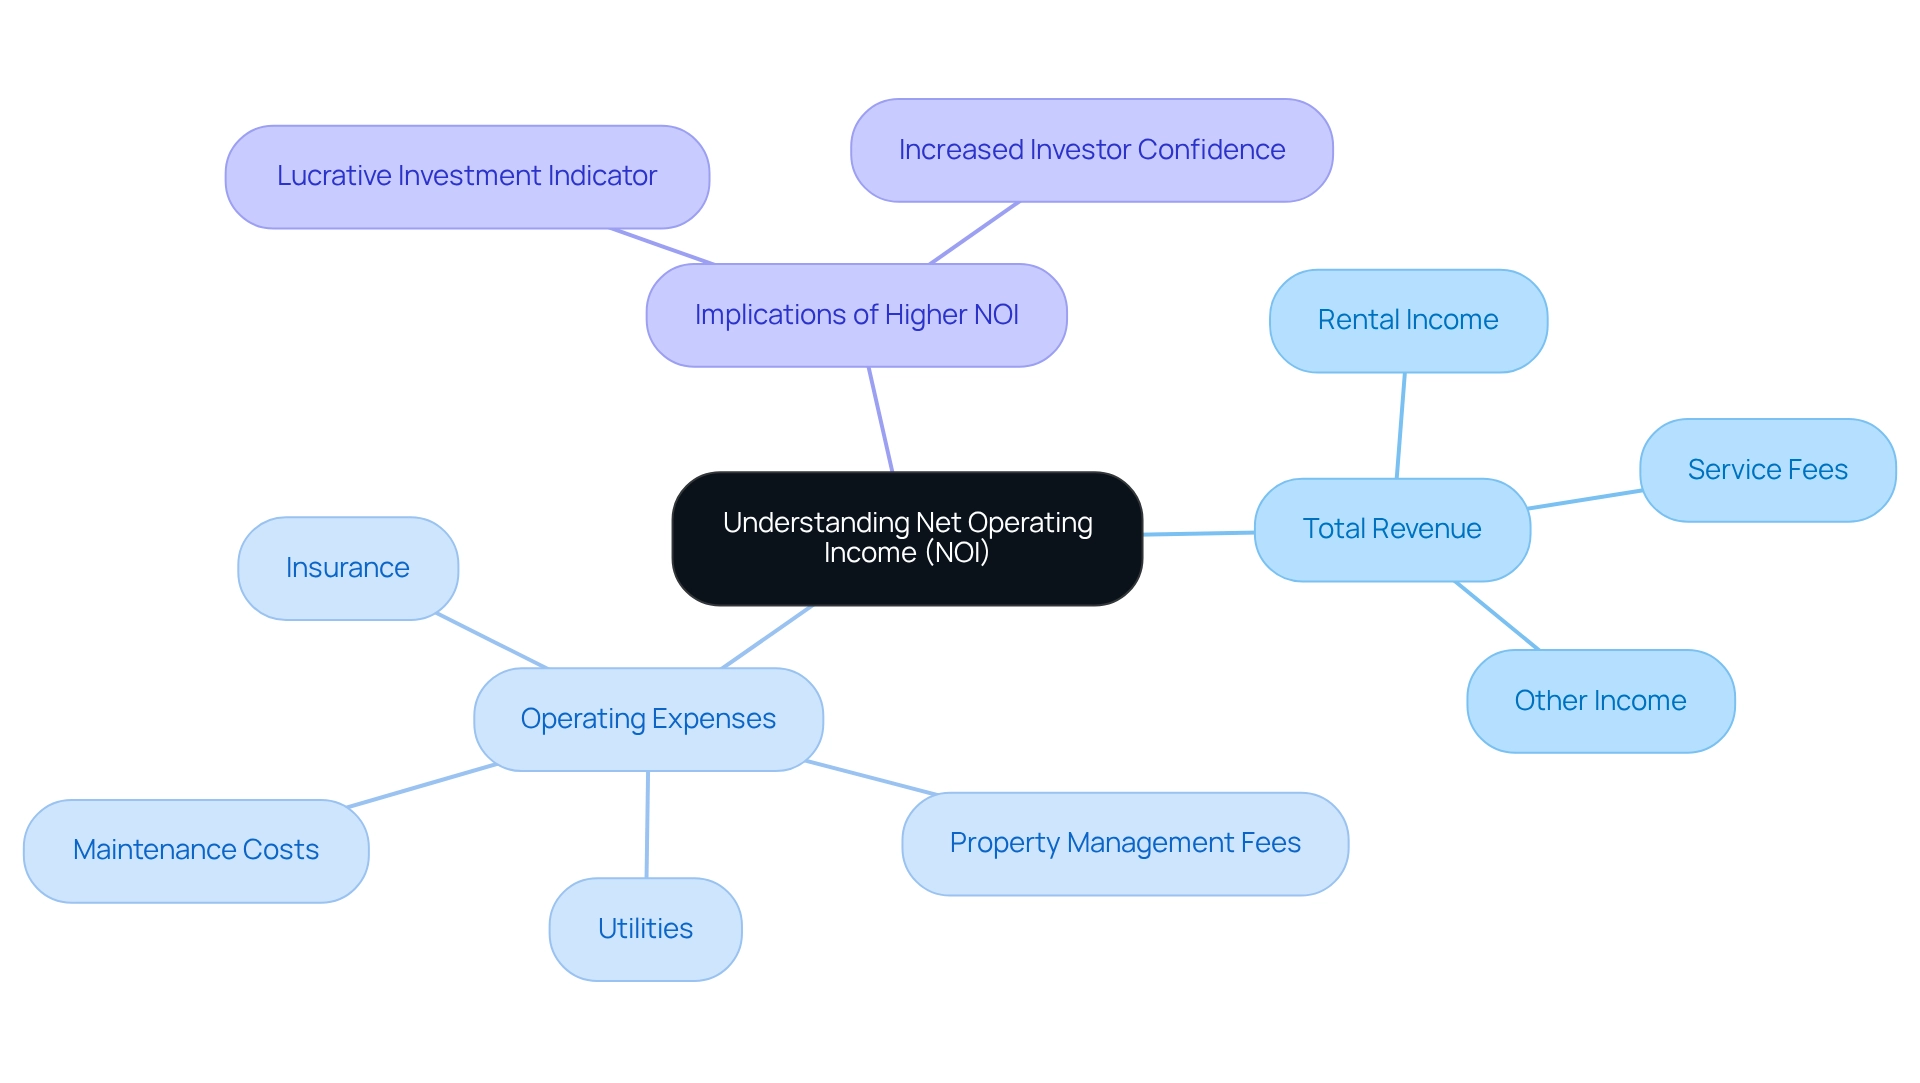
Net Operating Income (NOI) is calculated by subtracting all operating expenses from the total revenue generated by the asset. This critical metric serves as a barometer for investors, illustrating the asset's capacity to produce income prior to accounting for financing costs and taxes. A higher NOI indicates a more lucrative asset, solidifying its role as a key indicator in real estate metrics analysis.
To optimize investment performance, investors must consistently monitor real estate metrics, including NOI, to inform their management and financial strategies.
Capitalization Rate (Cap Rate)
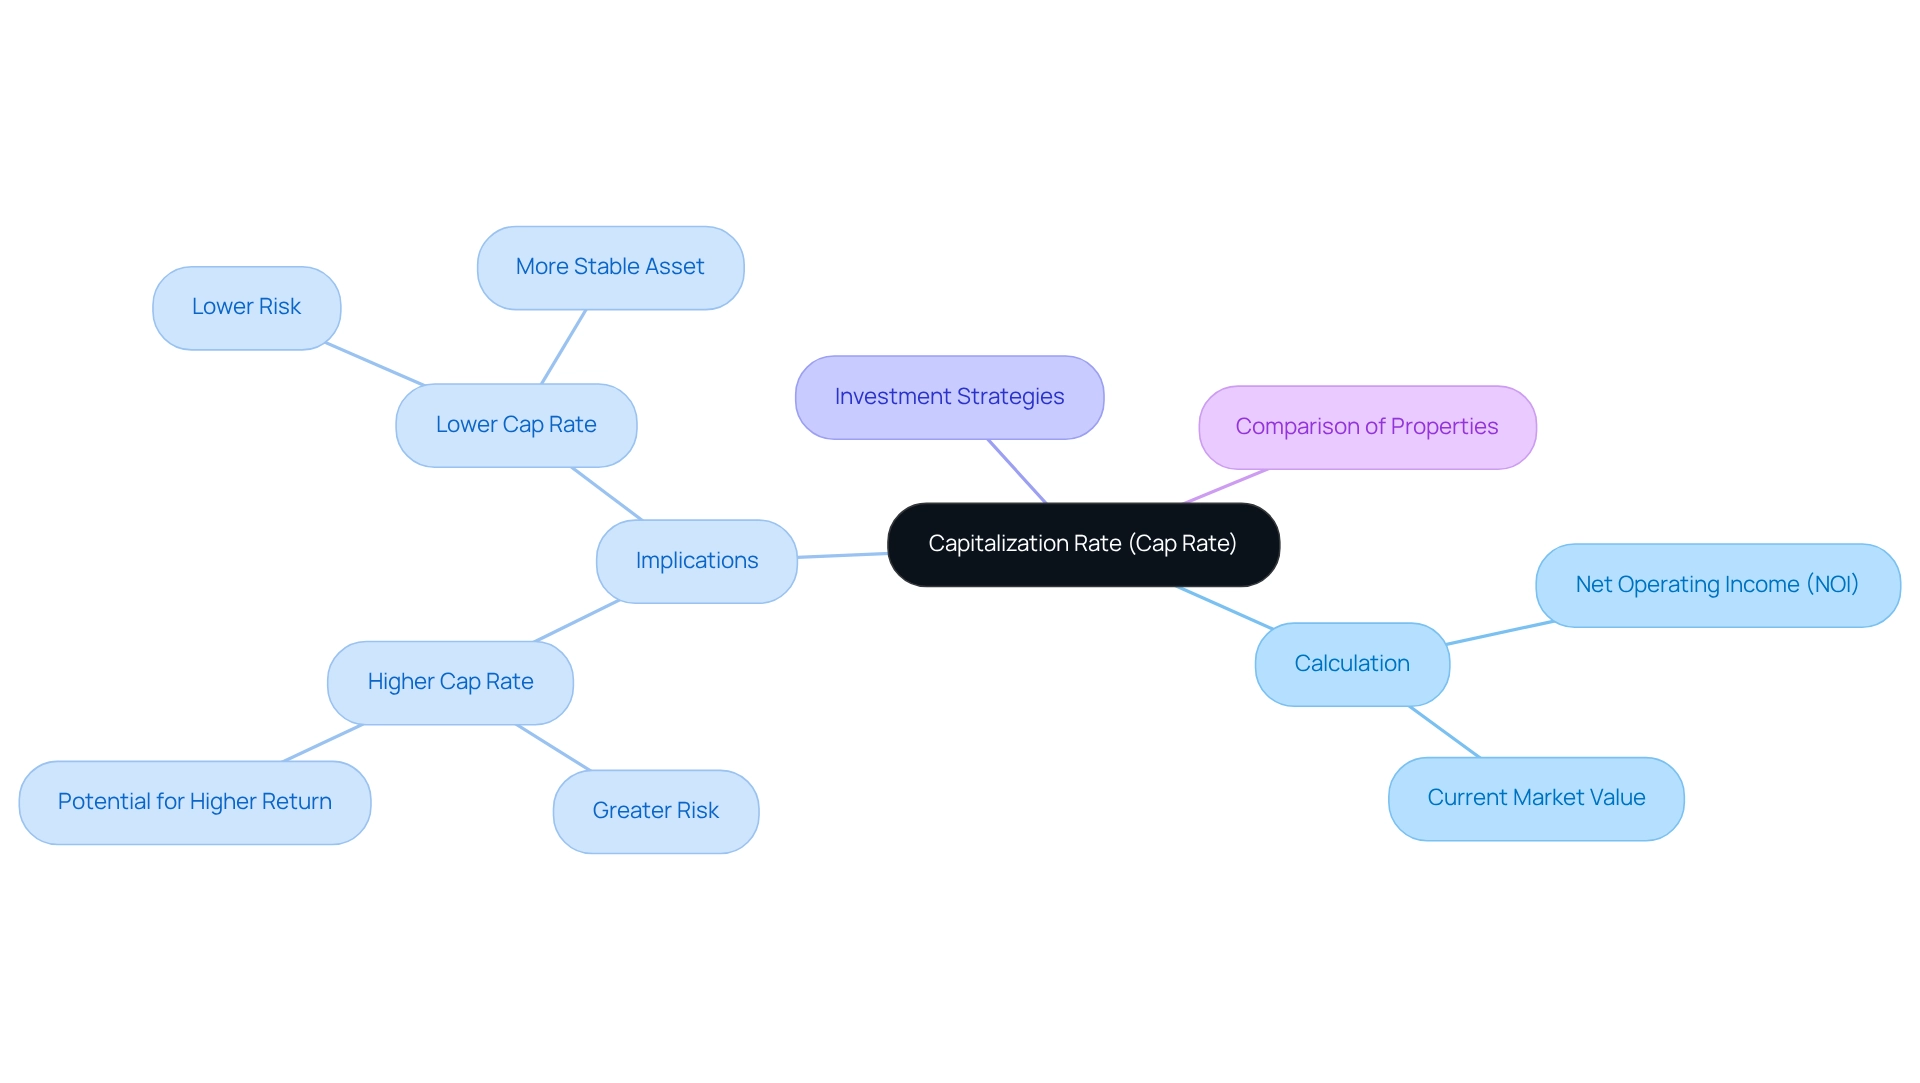
The Capitalization Rate (Cap Rate) serves as a crucial metric in real estate investment, calculated by dividing the Net Operating Income (NOI) by the property's current market value. This ratio provides investors with a swift and effective method to evaluate the anticipated return on their capital. A higher Cap Rate is typically indicative of greater risk and potential return, while a lower Cap Rate suggests a more stable asset.
Investors should leverage real estate metrics such as Cap Rate to compare similar properties, ultimately facilitating informed decisions regarding resource allocation. By understanding these dynamics, investors can better navigate the complexities of the market and optimize their investment strategies.
Internal Rate of Return (IRR)
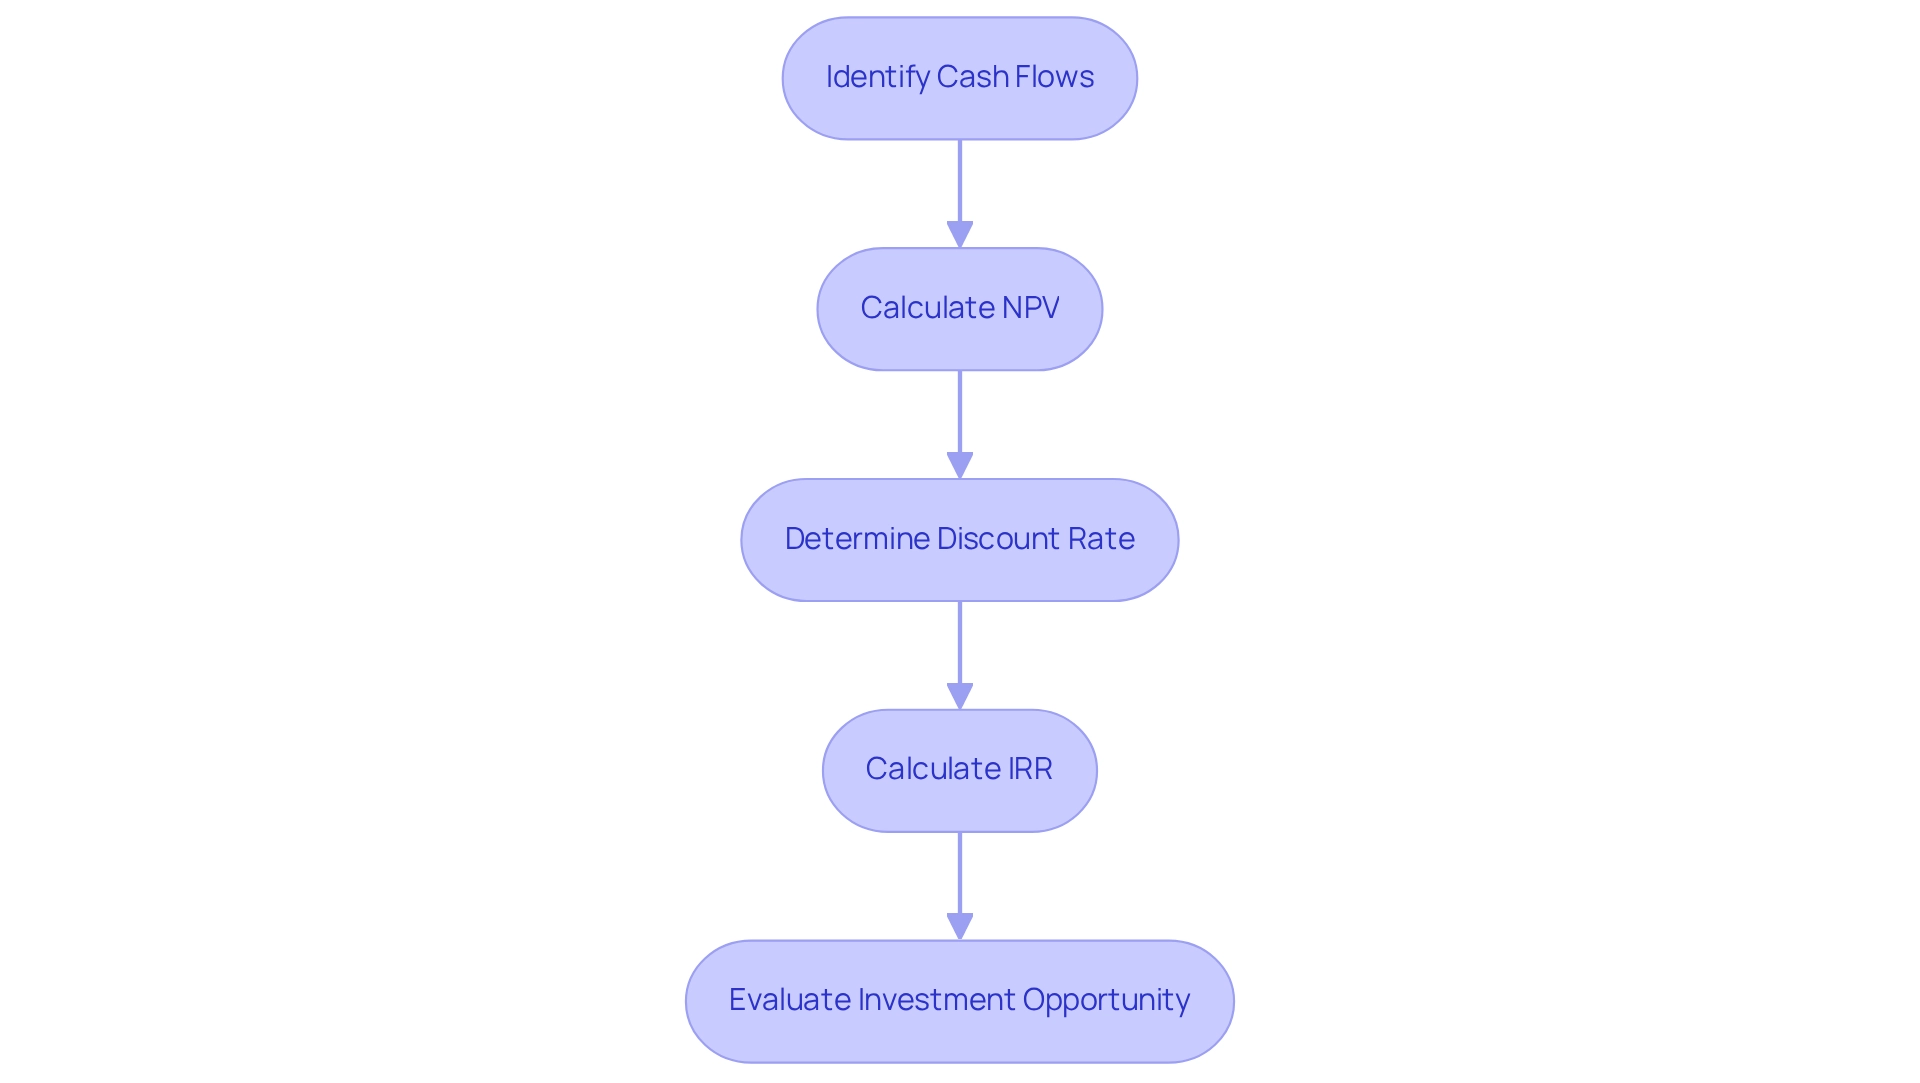
The Internal Rate of Return (IRR) serves as the discount rate that equates the net present value (NPV) of all cash flows from a venture to zero. This metric signifies the annualized rate of return expected from a financial investment throughout its holding period. Investors commonly leverage IRR to assess the profitability of diverse funding opportunities. A higher IRR indicates a more attractive opportunity, underscoring the necessity for investors to calculate and consider IRR when evaluating potential assets. By doing so, they can make informed decisions that align with their investment strategies.
Cash Flow
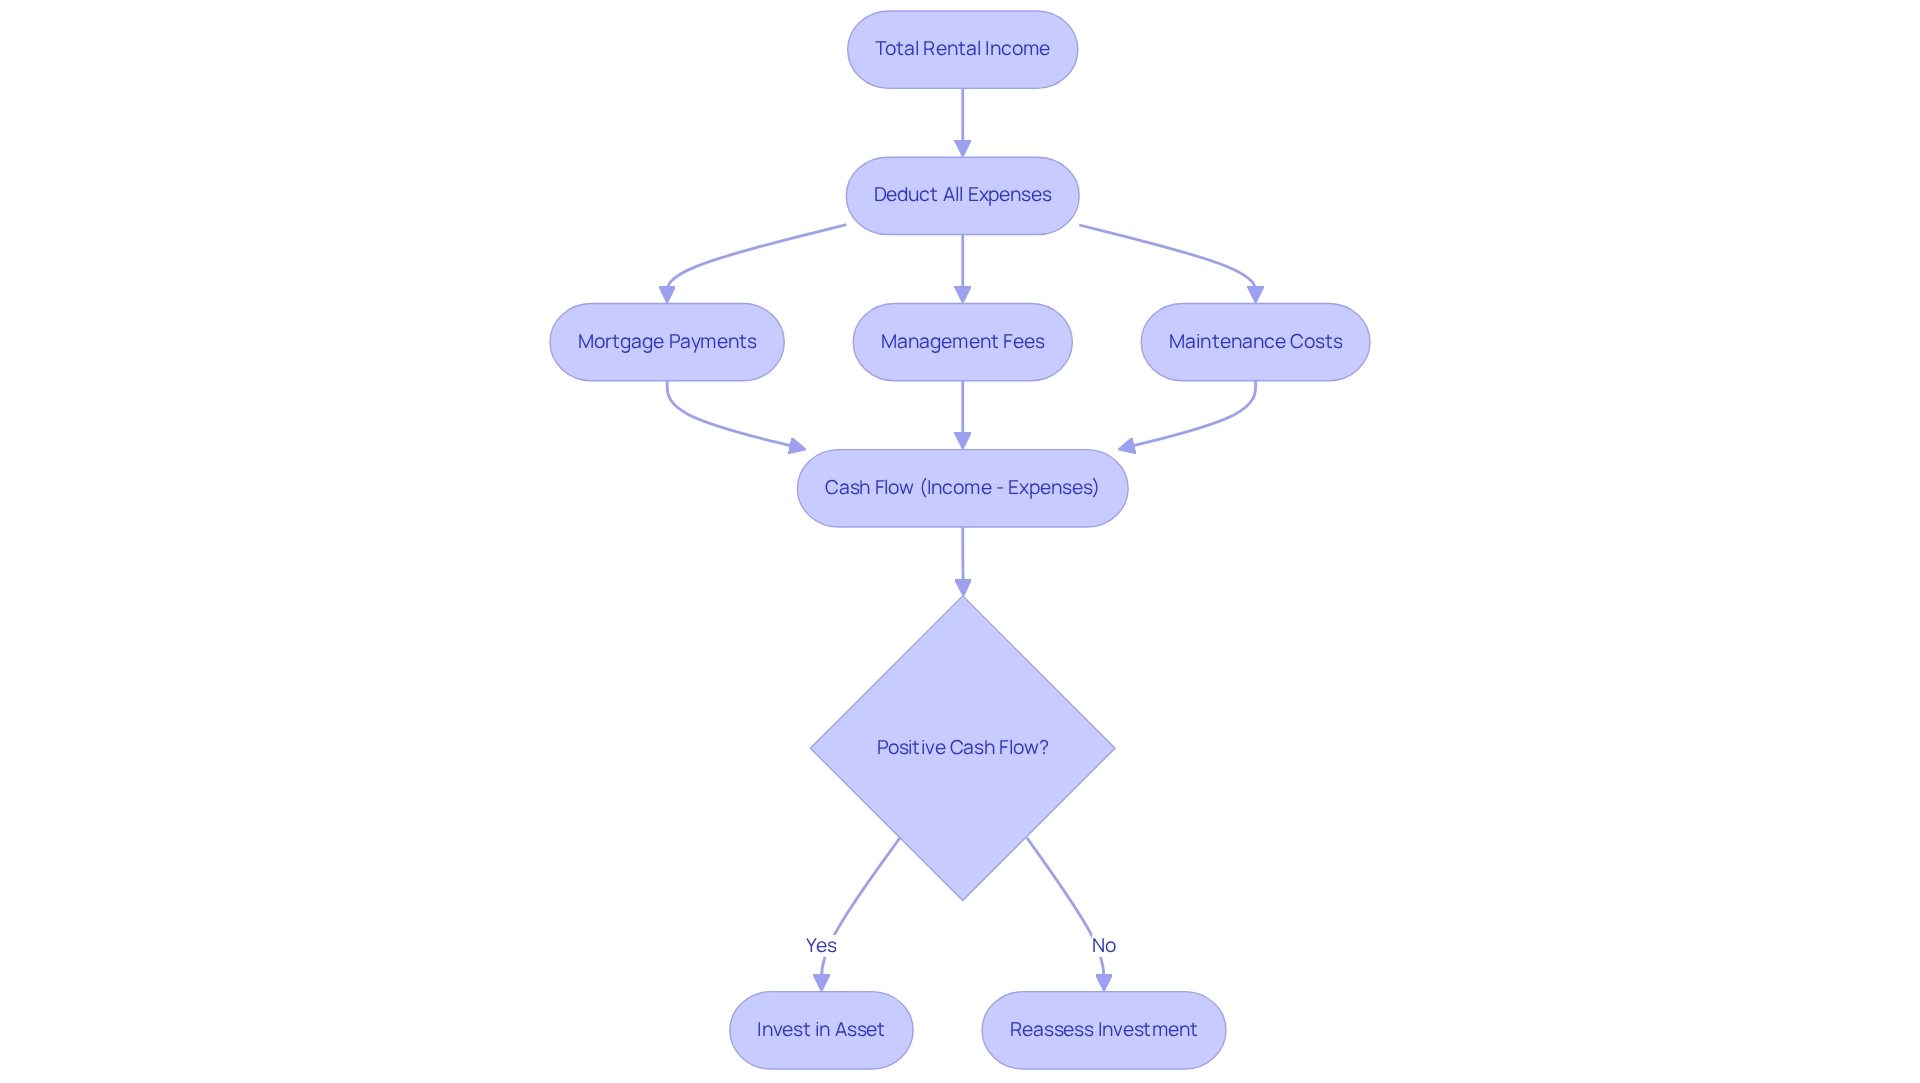
Cash flow is a critical metric in real estate investment, determined by deducting all expenses—including mortgage payments, management fees, and maintenance costs—from the total rental income generated by the asset. A positive cash flow indicates that the asset is producing more income than it incurs in operational costs, which is essential for long-term investment success.
Investors should focus on acquiring assets with robust cash flow, as this ensures financial stability and the ability to reinvest in further opportunities. By targeting properties that consistently generate positive cash flow, investors position themselves for sustained growth and profitability in the real estate market.
Cash on Cash Return
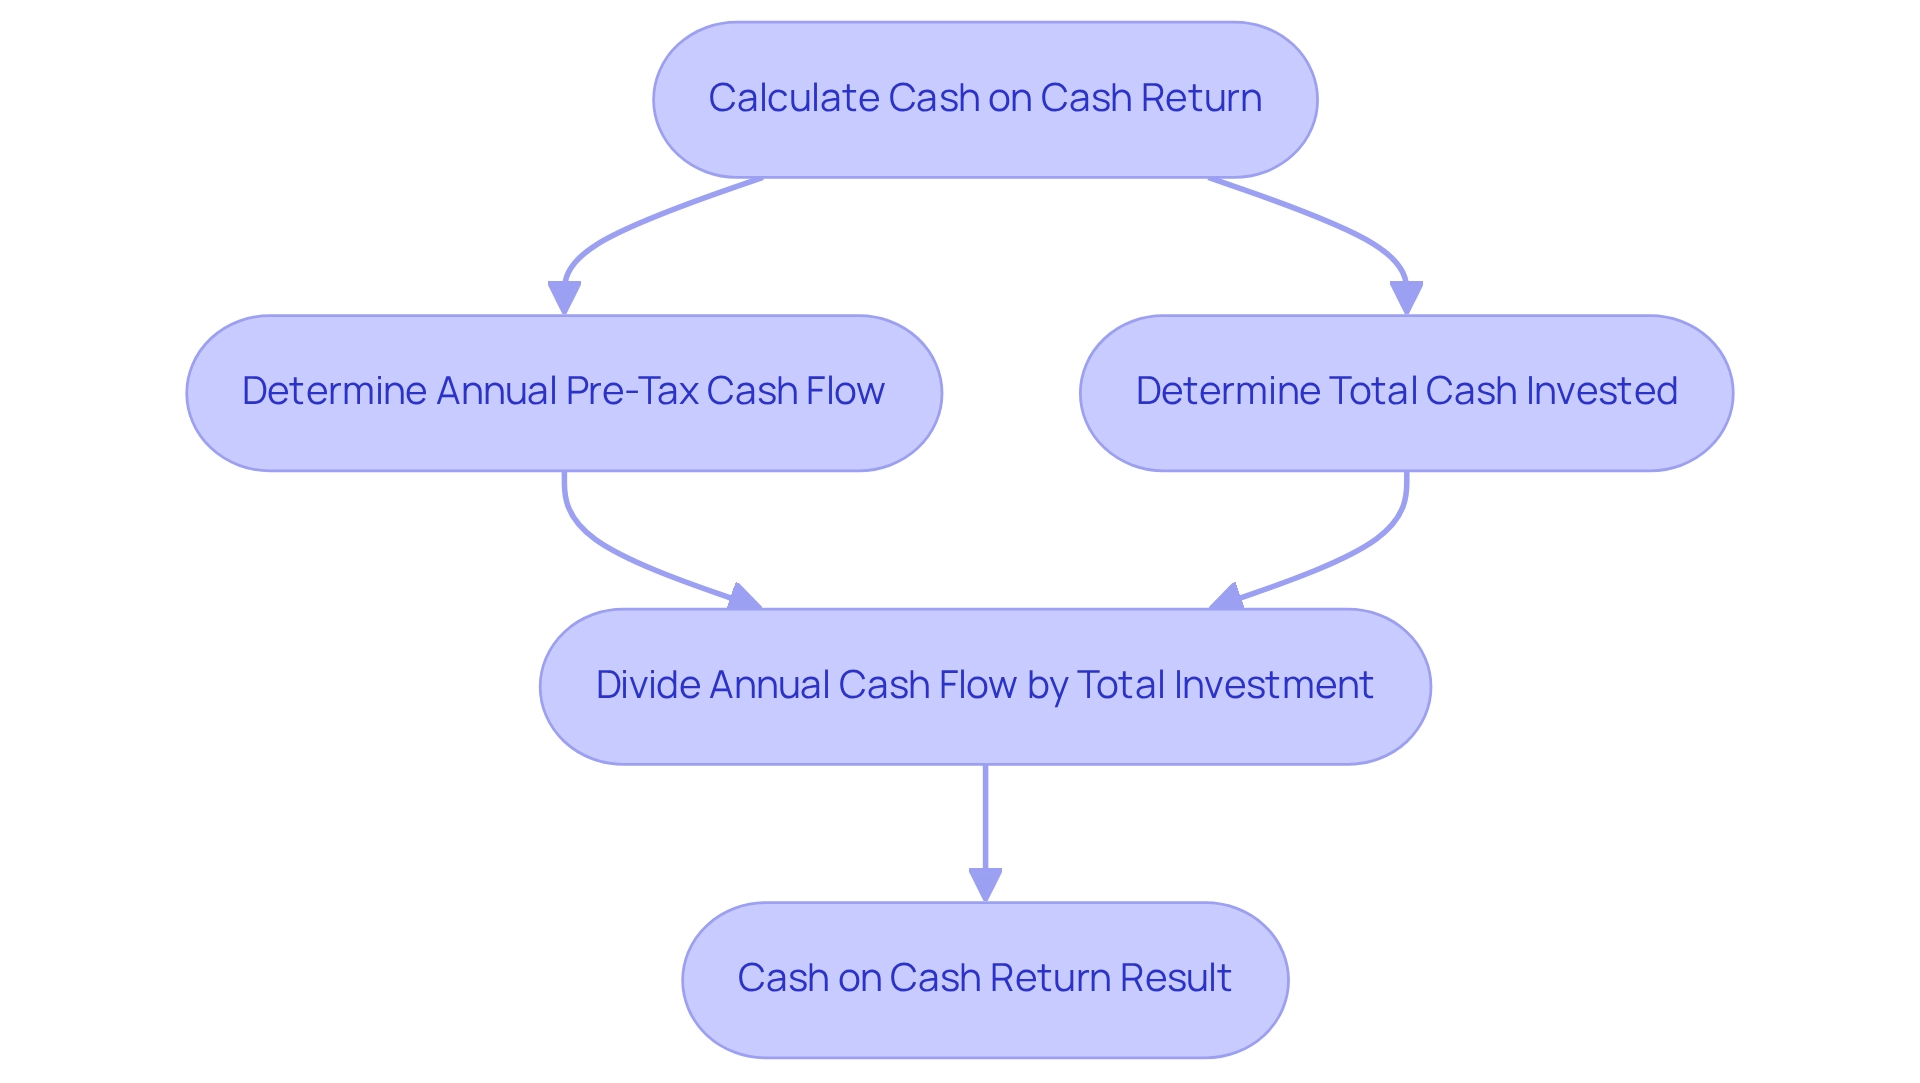
Cash on Cash Return is a vital metric in real estate investment, calculated by dividing the annual pre-tax cash flow by the total cash invested in the asset. This measurement offers investors a clear perspective on the efficiency of their capital in generating income. A higher cash on cash return signifies a more profitable venture, underscoring its importance for investors monitoring the performance of their real estate holdings. Understanding this metric enables investors to make informed decisions, optimizing their investment strategies for greater financial success.
Gross Rent Multiplier (GRM)
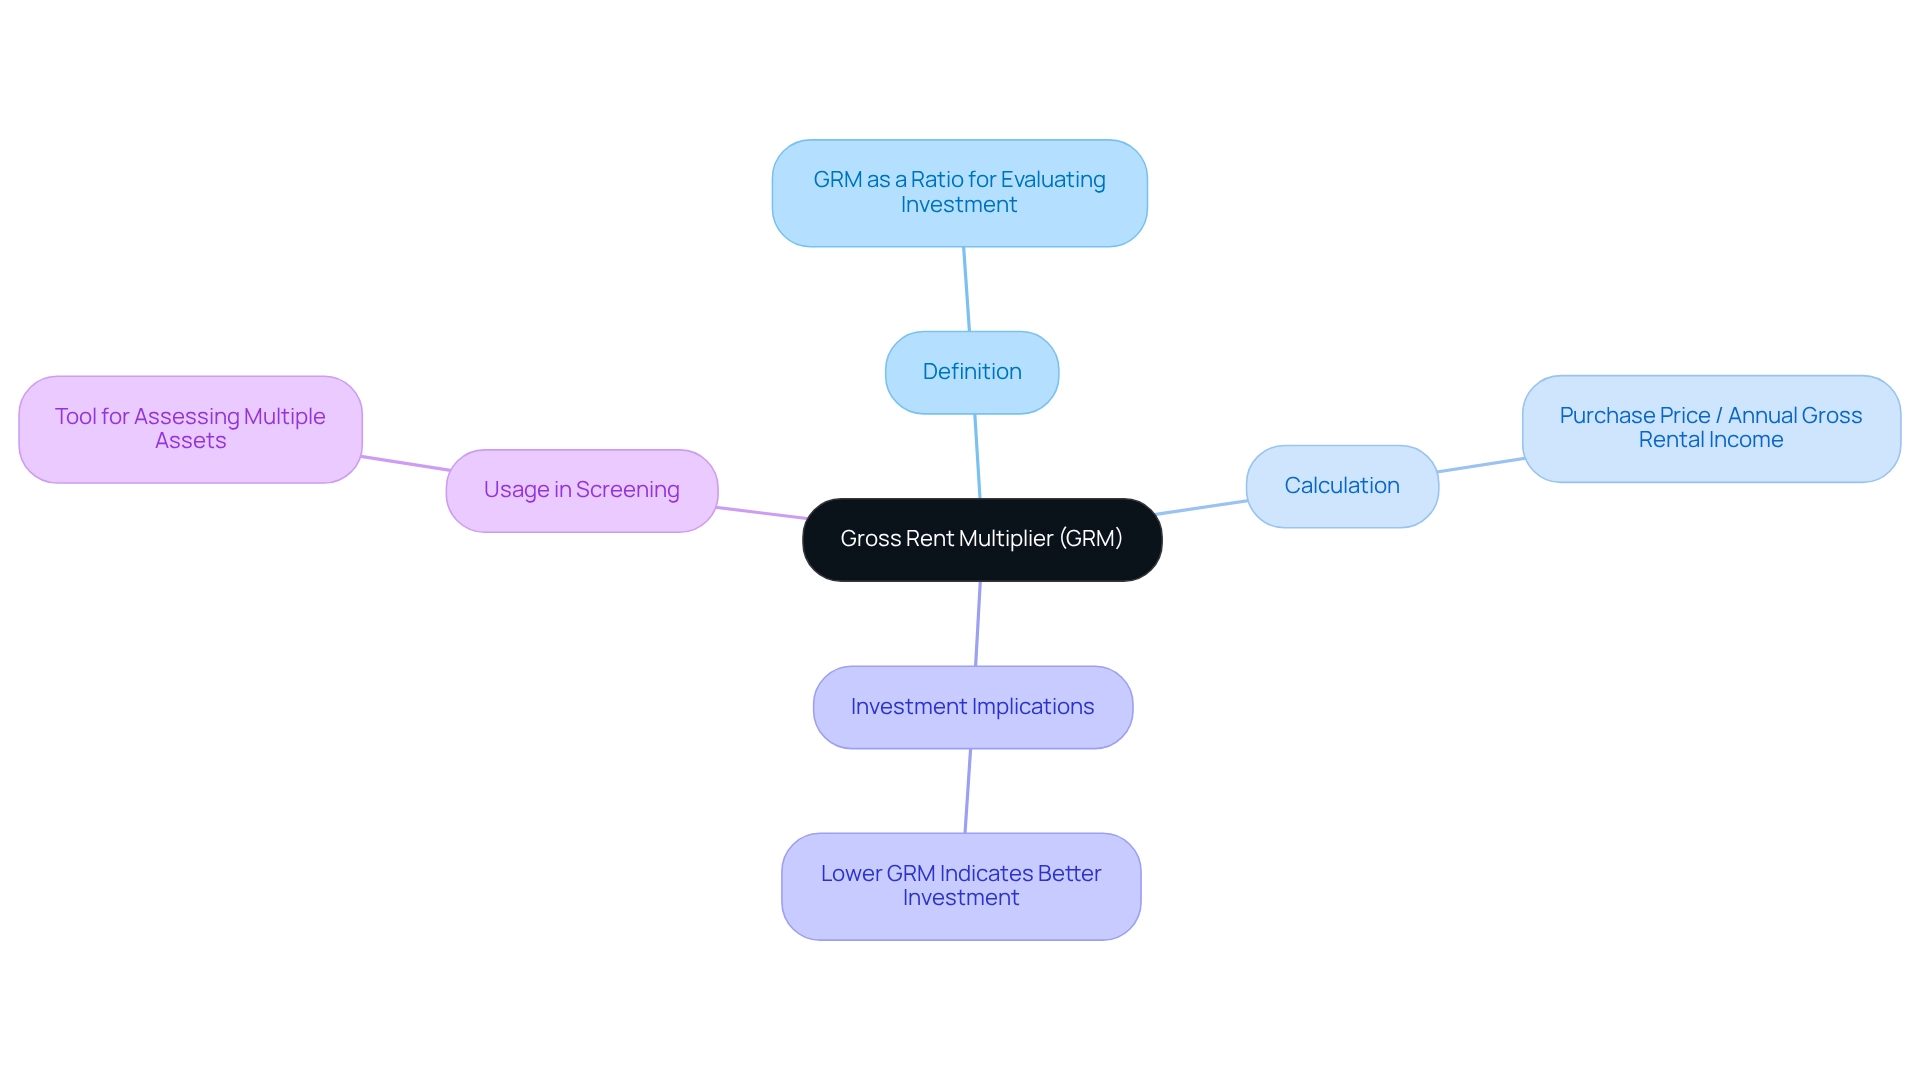
The Gross Rent Multiplier (GRM) serves as a critical metric in real estate investment, calculated by dividing the property's purchase price by its annual gross rental income. This ratio provides a swift evaluation of how long it will take for an investor to recover their capital through rental income. Notably, a lower GRM indicates a potentially better investment, suggesting a quicker return on investment.
Investors should leverage real estate metrics, including GRM, as an essential initial screening tool when assessing multiple assets. By understanding and utilizing GRM, investors can make informed decisions that enhance their investment strategies.
Loan-to-Value Ratio (LTV)
The Loan-to-Value Ratio (LTV) is a critical metric in real estate, calculated by dividing the mortgage loan amount by the asset's assessed value. A lower LTV signifies reduced risk for lenders, which often translates into more favorable loan terms for borrowers.
Investors should strive for a lower LTV, as it minimizes risk and enhances the likelihood of securing advantageous financing options. Understanding real estate metrics like LTV is essential for making informed decisions about property acquisitions and financing strategies.
By grasping the significance of LTV, investors can better navigate the complexities of the real estate market and optimize their investment outcomes.

Debt Service Coverage Ratio (DSCR)
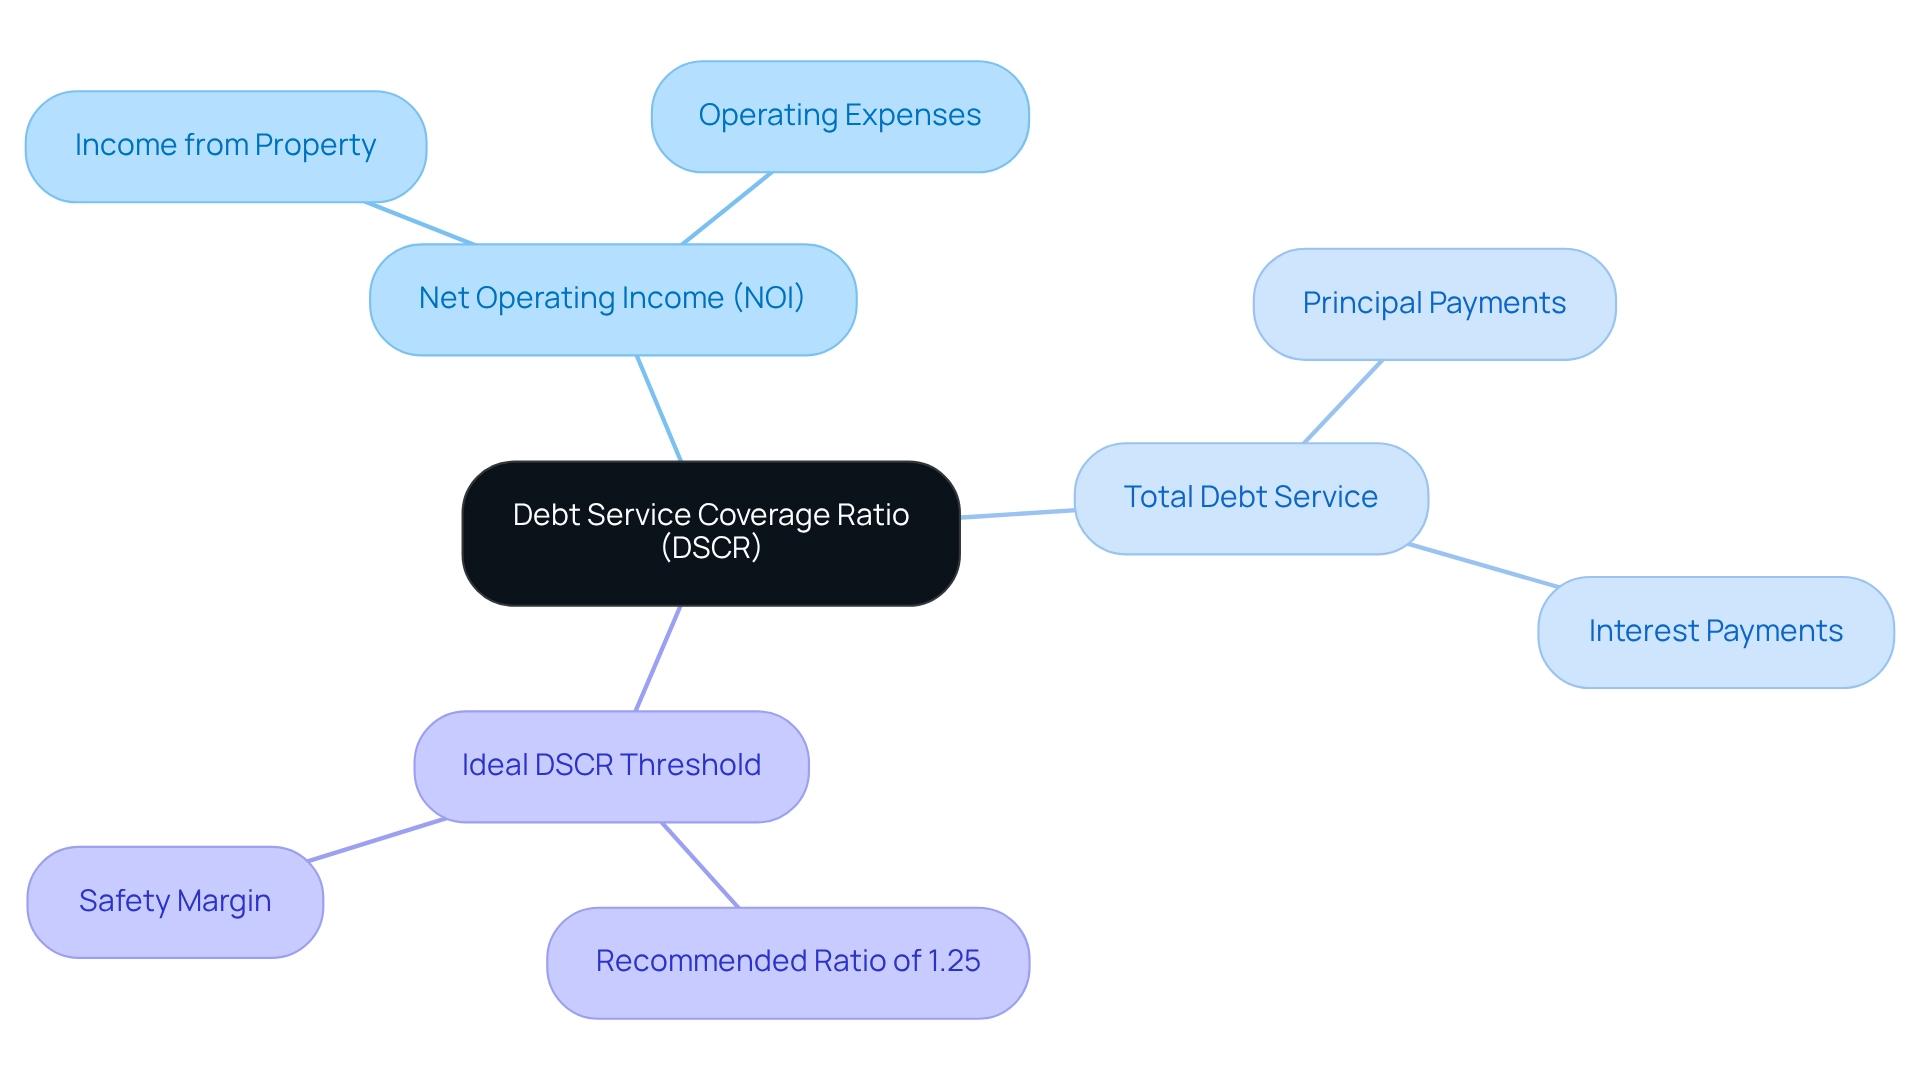
The Debt Service Coverage Ratio (DSCR) serves as a critical metric in real estate investment, calculated by dividing the Net Operating Income (NOI) by the total debt service, which includes both principal and interest payments. A DSCR greater than 1 signifies that the property generates sufficient income to meet its debt obligations, a vital criterion for securing financing.
Investors should aim for a DSCR of at least 1.25, as this benchmark not only ensures a healthy margin of safety but also enhances the overall stability of their investments.
Operating Expense Ratio (OER)
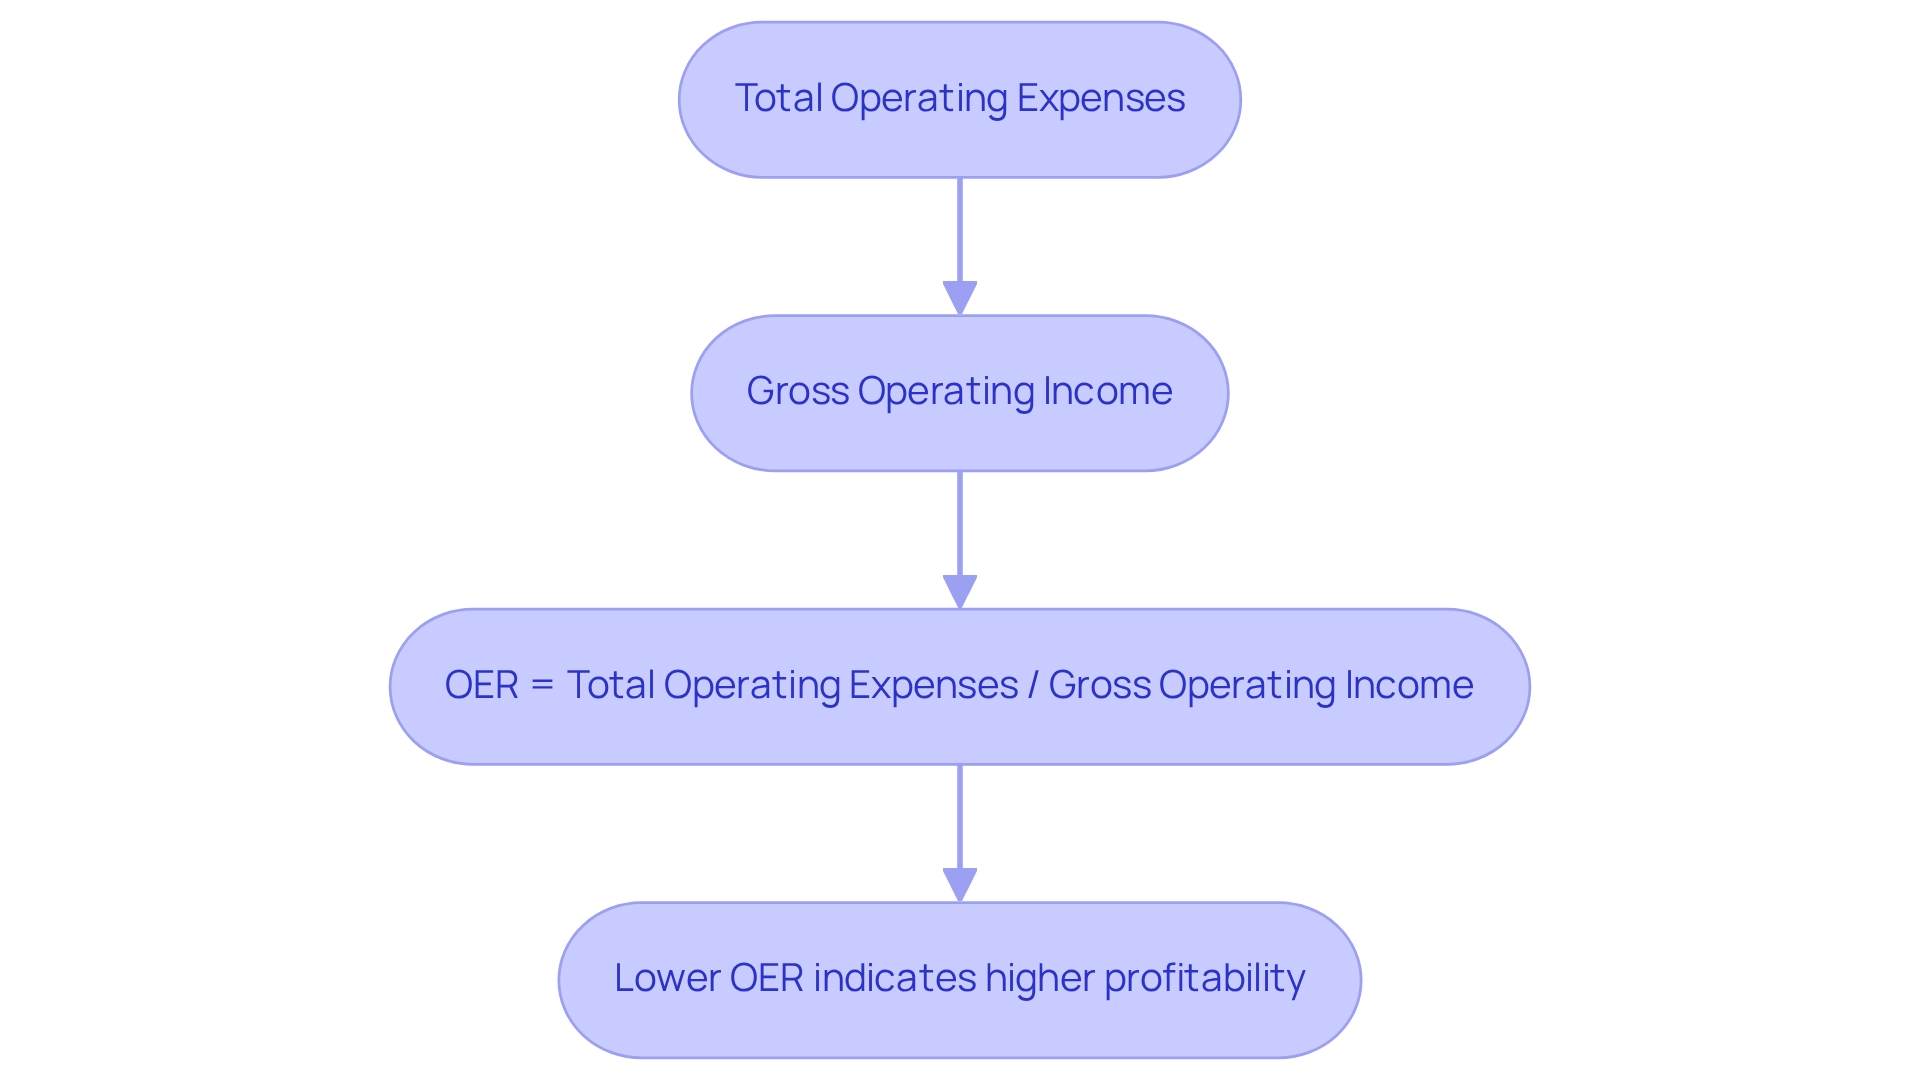
The Operating Expense Ratio (OER) is a critical metric in real estate, calculated by dividing total operating expenses by gross operating income. This ratio serves as a vital tool for investors, enabling them to assess the efficiency with which an asset's real estate metrics are managed. A lower OER indicates that an asset is generating more income relative to its expenses, which is a positive signal for investors. Furthermore, by monitoring real estate metrics, investors can pinpoint areas for cost reduction, ultimately enhancing overall profitability.
Physical Vacancy Rate
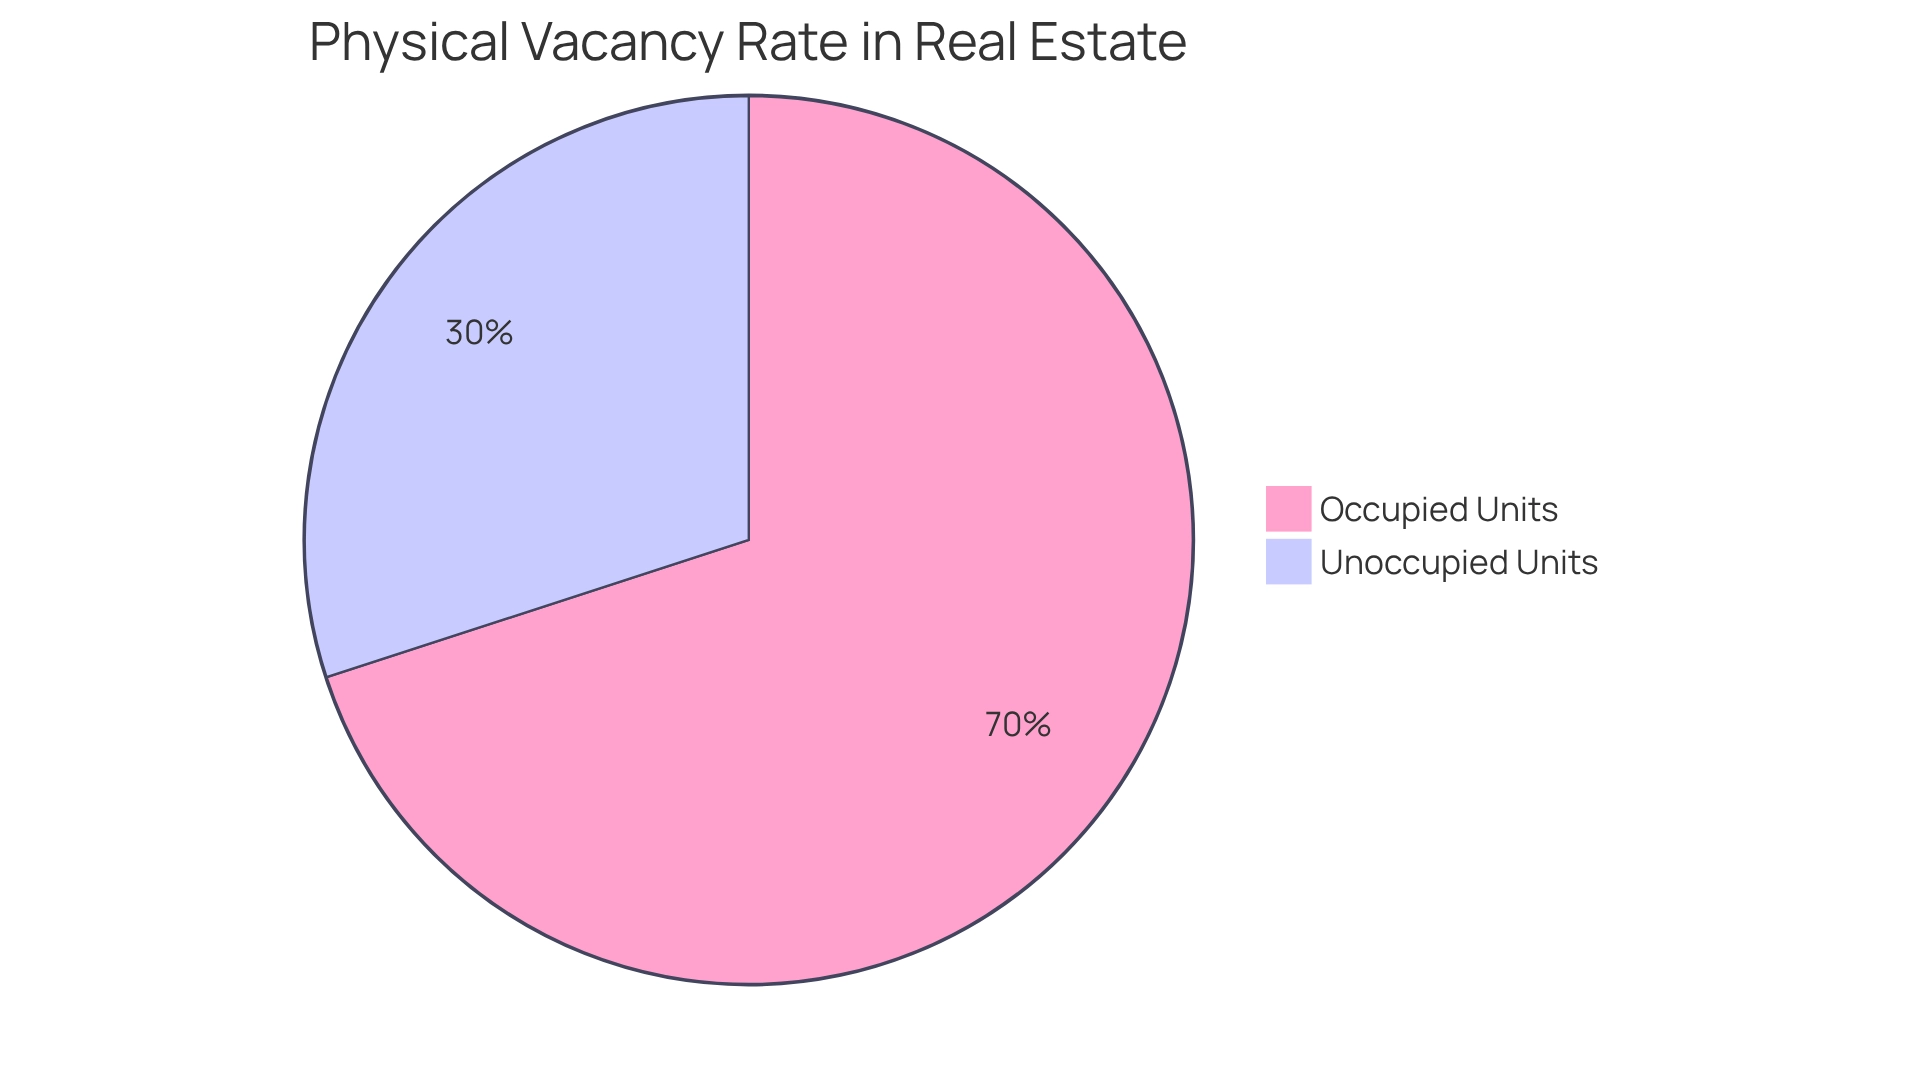
The Physical Vacancy Rate serves as a critical metric in real estate, calculated by dividing the number of unoccupied units by the total number of units in a building. This percentage not only indicates how many units are unoccupied but also serves as a barometer for potential issues related to desirability or pricing.
A reduced vacancy rate signals robust demand and effective management, while an increased rate may highlight underlying problems that necessitate attention. Investors must regularly monitor vacancy rates, as these essential metrics inform strategic decisions regarding pricing, marketing, and property enhancements.
Understanding and acting upon these insights can significantly influence investment success.
Conclusion
In the realm of real estate investment, mastering key financial metrics is not merely beneficial; it is essential for achieving long-term success. Metrics such as:
- Net Operating Income (NOI)
- Capitalization Rate (Cap Rate)
- Internal Rate of Return (IRR)
provide investors with critical insights into property performance and investment viability. By understanding these indicators, investors can assess income generation potential, compare properties effectively, and make informed decisions that align with their investment goals.
Equally important are metrics like:
- Cash Flow
- Cash on Cash Return
- Debt Service Coverage Ratio (DSCR)
which highlight the financial health and operational efficiency of properties. Positive cash flow ensures that investments remain sustainable, while a solid DSCR indicates the ability to meet debt obligations. Additionally, tools such as:
- Gross Rent Multiplier (GRM)
- Operating Expense Ratio (OER)
serve as valuable screening and management indicators, helping investors identify properties that promise better returns and efficient operations.
Ultimately, a comprehensive understanding of these financial metrics empowers real estate investors to navigate a competitive market with confidence. By regularly monitoring these key indicators, investors can optimize their portfolios, mitigate risks, and enhance their overall investment strategies. As the landscape of real estate continues to evolve, staying informed and adaptable will be crucial for those seeking to thrive in this dynamic field.


